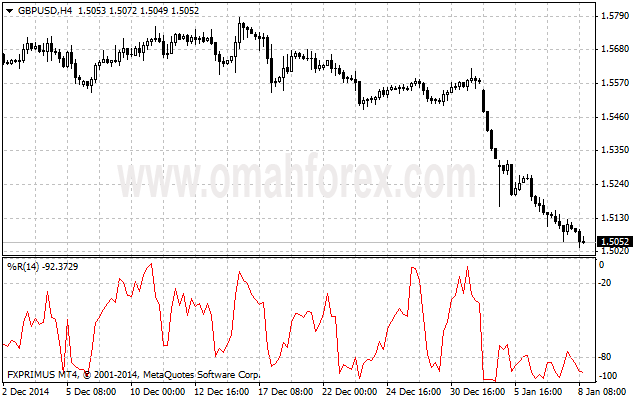
Williams Percent Range (%R) is a technical indicator developed by Larry Williams to identify whether an asset is overbought or oversold and therefore to determine possible turning points. Unlike the Stochastic oscillator Williams Percent Range is a single line fluctuating on a reverse scale.
How to Use Williams Percent Range Indicator
The main goal of Williams Percent Range is to identify possible overbought and oversold areas, however the indicator should be considered within trend analysis:
- Generally if the indicator climbs above -20, the asset may be overbought;
- If the indicator drops below -80, the asset may be oversold.
- Leaving extreme areas the indicator may suggest possible turning points:
- Crossing the overbought boundary from above, Williams Percent Range signals a possible sell opportunity;
- Crossing the oversold boundary from below, Williams Percent Range signals a possible buy opportunity.
- Divergence patterns are rare, but may indicate possible trend weakness:
- If the price climbs to a new high, but the indicator does not, that may be a sign of the uptrend weakness;
- If the price falls to a new low, but the indicator does not, that may be a sign of the downtrend weakness.

Williams %R Trading Strategy
Williams %r indicator, as already mentioned, helps to determine the points when the market is oversold or overbought. The trading rules of %R strategy are simple: buying when the market is oversold (%R reaches -80% or lower) and selling when the market is overbought (%R reaches -20% or higher).
Williams %R Formula (Calculation)
R% = – ((H – C)/(H – L)) x 100;
where:
C – latest close price;
L – the lowest price over a given period;
H – the highest price over a given period.
How to Install Williams% R indicator in MT4 Charts
Williams% R indicator is standard Metatrader indicators, to put this indicator in your chart, please click Insert >> Indicator >> Oscillator >> William’s Percent range. The default setting of this indicator is 14 periods.


