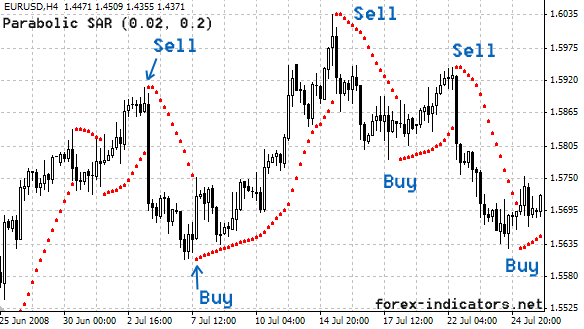
Parabolic SAR indicator in trading involves the following signals:
- PSAR’s dot above the price -> Downtrend.
- PSAR’s dot below the price -> Uptrend.
Details
Parabolic SAR indicator is trend indicator, which describes to forex trader about stop price point , price reverse and trend direction. This concept of its use is easy to understand. Parabolic SAR appears as a set of dashed lines, where each point represents a certain period of time.
When the price is above the Parabolic SAR’s dot, the trader must hold the Long (buy) position only. Once the Parabolic SAR ‘s dot is above the price – it is time to change the trading position for Short (sell). Parabolic SAR indicator allows to be in trading all the time.

How to trade by using Parabolic SAR Indicator
Trading with Parabolic SAR is not that simple, not all reversal signals (reversals) Parabolic SAR can be profitable in trading.
Let’s move on to the advice given by Parabolic SAR developer – J. Welles Wilder. He suggests using Parabolic SAR, first of all, for trailing stop (protecting profit) and finding the best exit stop.
The way traders use Parabolic SAR is by simply setting a stop loss order at the latest SAR’s dot that appears on the graph. This stop loss then follows along with each new SAR dot until the trend remains intact. After the indicator SAR dot change appears on the opposite side of the price, then the trading position should be closed (close order).
Welles Wilder does not recommend the use of Parabolic SAR as an independent indicator. The main reasons for that are: Parabolic SAR can easily create whip-saws (false signals) during the market consolidation period. The best Parabolic SAR period is during a strong trend, Wilder himself estimates about 30% of the period. So traders will need other technical indicators to identify that period is a strong trend.
For himself, Welles Wilder developed the ADX indicator – another trend indicator that tells whether the dominant trend and how strong the trend is. After knowing how strong trends, traders can choose the appropriate signal from Parabolic SAR and ignore the rest.
How do you determine trends if you do not want to use ADX?, try EMA periode 50. Price reading above EMA 50 will show uptrend, and below EMA 50 means downtrend.
Parabolic SAR Indicator Setting
Thus, Parabolic SAR is developed to keep the stop loss level and move to adjust to the new price and thus lock in profits in trading.
The Parabolic SAR formula includes “acceleration factors”, which allow it to react to rapid market changes as trends begin to accelerate. At first, new Parabolic SAR’s dot are placed adjacent and then accelerate as an initial trend.
Parabolic SAR has two variables: steps and max step. The settings recommended by W. Wilder are: steps 0.02 and step max is 0.2.
Parabolic SAR indicator step sensitivity setting. If the step is too high, Parabolic SAR becomes more sensitive and will flip back and forth more often, with the lower step Parabolic SAR will become smoother. Setting Max step: The higher the max step the closer the trailing stop to the price.
Parabolic SAR Indicator Tips – useful:
Tip 1:
When the distance between Parabolic SAR’s dot increases significantly, this indicates that the acceleration formula for SAR is working. So, if you have been wrong in the exit placement, it may be better to avoid late entries and will wait for the opportunity to re-enter the trade with help, other indicators eg, Stochastic indicators.
Tip 2:
Parabolic SAR is only a mathematical interpretation of the price. While it helps to identify entry points for stop points, it may not be the best ending for you. traders also see support/resistance levels, round numbers, trend lines, etc. to find a better place to place orders and stop.
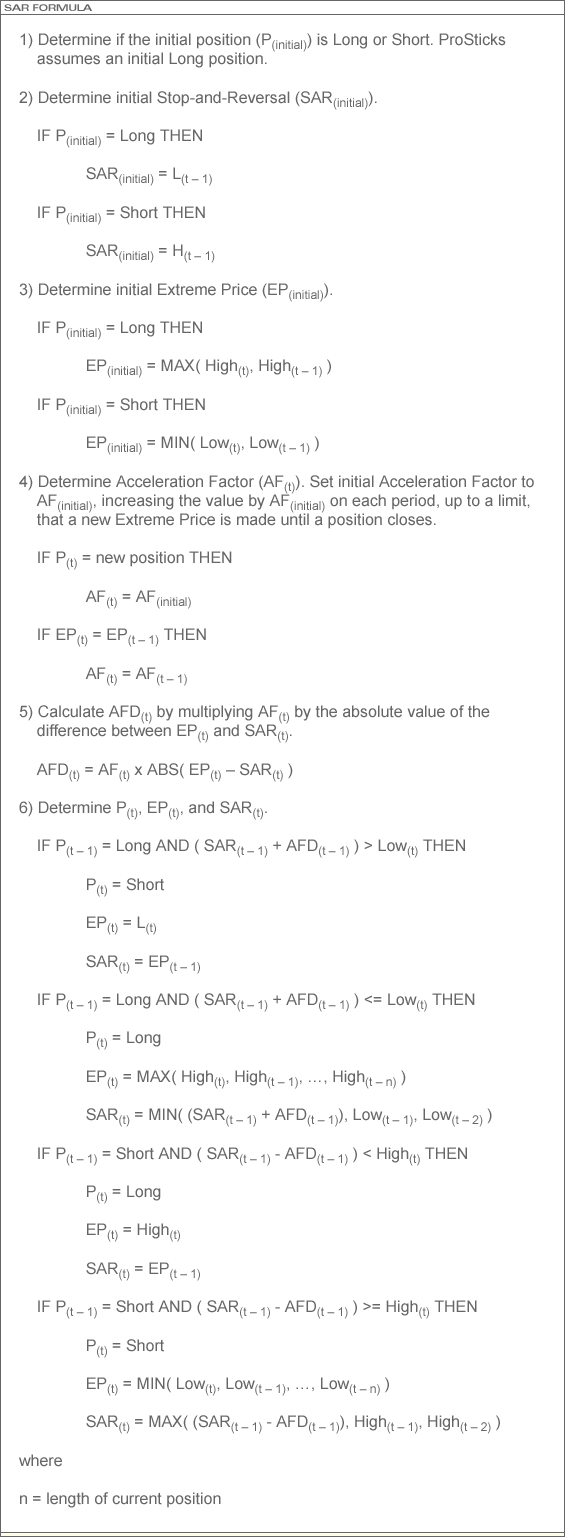
Parabolic SAR indicator formula

How to install Parabolic SAR Indicators in MT4 Platform
To install the parabolic SAR indicator on MT4 follow these steps:
Click menu: Insert -> Indicators -> Trend -> Parabolic SAR


