Fractals Indicator – an indicator introduced by Bill Williams.
Simple and versatile, fractals can be used as a stand-alone indicator or in combination with other Forex indicators
Bill Williams also gives us his approach to using fractals in trading, which we are going to highlight here as well. But before that, let’s touch
The basics of Fractals indicator
Fractals point tops and bottoms where market reverses.
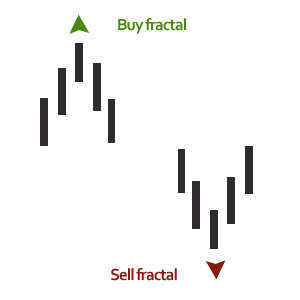
In order for a fractal to form, there should be a series of 5 consecutive bars where the middle bar will be the highest preceded and followed by two lower neighboring bars on each side:
- a Buy fractal forms at the top of the price wave with the Highest High in the middle and two Lower highs on each side;
- a Sell fractal forms at the bottom of the price wave with the Lowest Low in the middle and two Higher Lows on each side;
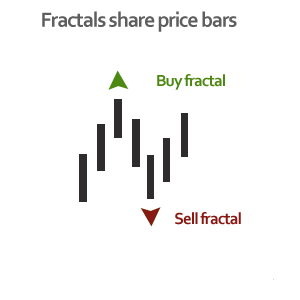
Buy and Sell fractals may share price bars (e.g. use the same bars from the set of 5).
How to Use Fractals Indicator in Forex Trading
Fractals as breakout points
Since fractals highlight points at which price failed to hold and therefore reversed, it is logical that once price beats its old fractal, there is a new strength coming. Setting a trade at the breakout point is an obvious and simplest application of the Fractals indicator.
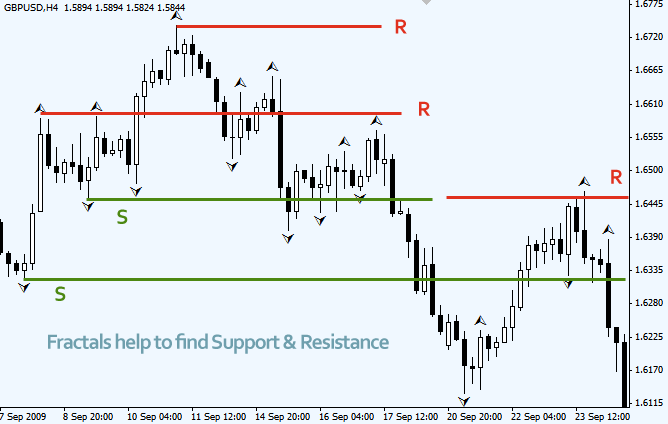
Another way to describe it: fractals help to see the levels of Support and Resistance.
There are some S/R levels shown below:
Fractals as trend line connecting points
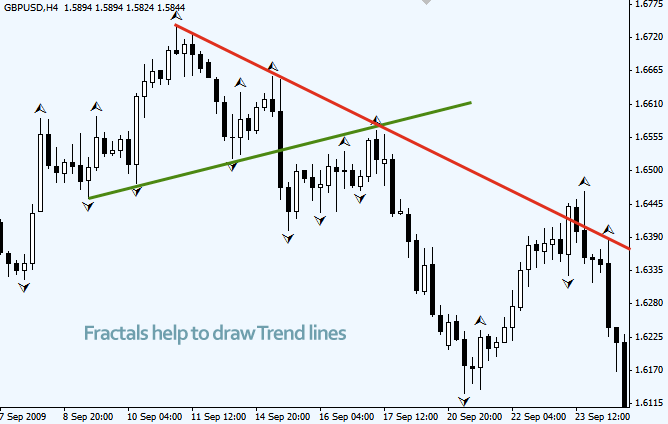
Fractals indicator makes it easy to identify and connect the most significant tops and bottoms needed to draw a trend line. Drawing trend lines using fractals could give some advantage to Forex traders since other market participants might also be using the same obvious price points for drawing trend lines.
Fractals as trend confirmation
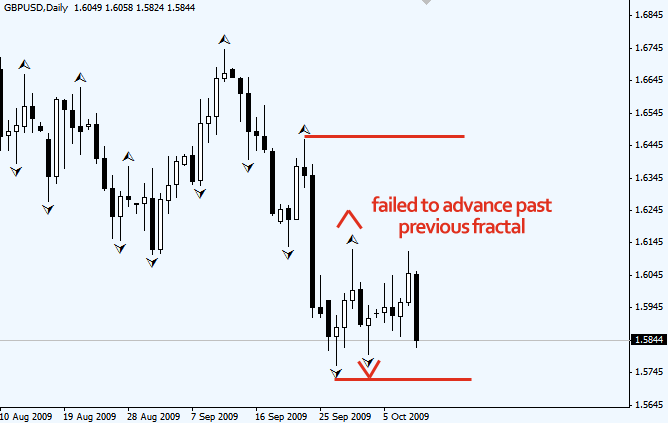
In an uptrend we will witness that there are more up fractals broken than down fractals. In a downtrend there will be more down fractals broken. As trend (up or down) progresses a successive break and advance of new fractals will be seen. Should the break of the previous fractal fail, we get a first sign of price consolidation.
Fractals for trend consolidation
Failure to successfully advance past previous fractal puts price on a consolidation path. To avoid an immediate coiling price will attempt to break at the opposite fractal. Should this move also fail to bring results, traders should prepare for a ranging market period till a new successful breakout.
Fractals trading: Bill Williams’ Chaos Theory
Fractals indicator is one of five indicators of Bill Williams’ trading system. According to his system, Fractals have to be filtered with the help of Alligator indicator.
Fractals should be traded the following way:
- If a Buy fractal is above the Alligator’s teeth (red Alligator line) traders should place a pending Buy order few points above the high of the buy fractal;
- If a Sell fractal is below the Alligator’s teeth traders should place a pending Sell Stop order few points below the low of the sell fractal.
- Don’t take any Buy positions if a fractal is formed below the Alligator’s teeth.
- Don’t take any Sell positions if a fractal is formed above the Alligator’s teeth.
Main rule above all rules when following Bill Williams’ method: don’t take any signals from other indicators (Gator Oscillator, Awesome Oscillator, Market Facilitation Index Indicator etc) until the first fractal (buy or sell) is formed outside the Alligator’s teeth.
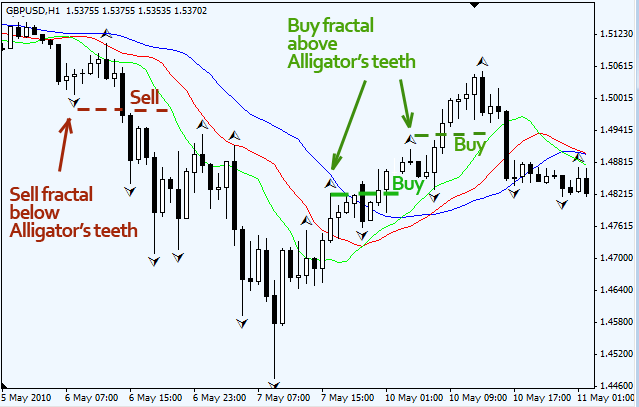
Such signaling fractals remain valid till a pending entry order is triggered or a new valid fractal is formed (a position will then be re-set according with the new fractal).Consecutive fractals going in the same direction that are formed after the first order if triggered can be used to add on to an open trade.


