Bollinger Bands indicator – a simple but powerful indicator, ideal for traders who love the visual style of forex trading. Created by John Bollinger, Bollinger Bands indicator that measures market volatility and provides a wealth of useful information:
- Trend direction
- Trends continued or paused
- The period of market consolidation
Periods of massive future volatility breackouts - Peak and the lowest price of the relative market and price target.
How to Read Bollinger Bands Indicator
The Bollinger Bands indicator consists of three bands, which are 85% of the time within limits:
- Simple moving average (SMA) in the middle (with default value of 20).
- Lower band – SMA minus 2 standard deviation.
- Upper band – SMA plus 2 standard deviations.
The default value for Bollinger Bands is (20,2) – When the market becomes more unstable, the bands will correspond to widening and move away form the center line. When the market slows down and becomes less stable, the bands will move closer together.
How to trade with Bollinger Bands Indicator?
The price moves above the band’s channel – uptrend, lower – downtrend
It is very simple to identify the dominance of the price direction simply by answering the question: in which part of the Bollinger band the price is currently traded? If the price stays above the midline – in the upper channel – then we get the prevailing uptrend. If it is below the midline – in the lower channel – then we get the downtrend in effect.
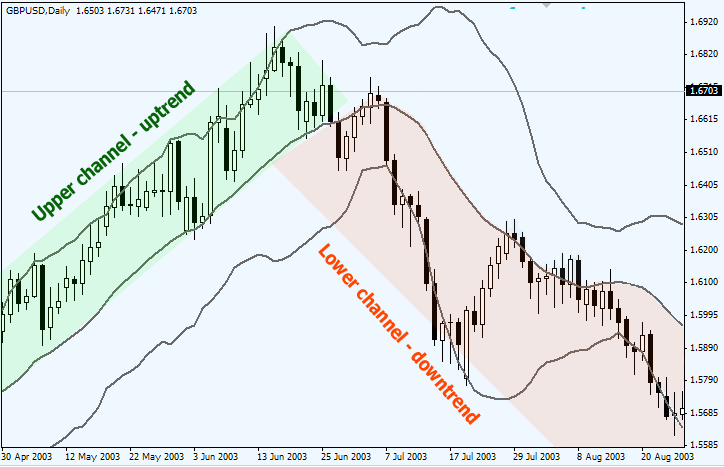
And only if you have lost the beginning of the trend, Bollinger bands can help you get the trend. Simply search the dips against the Bollinger band midline and enter in the direction of the trend.
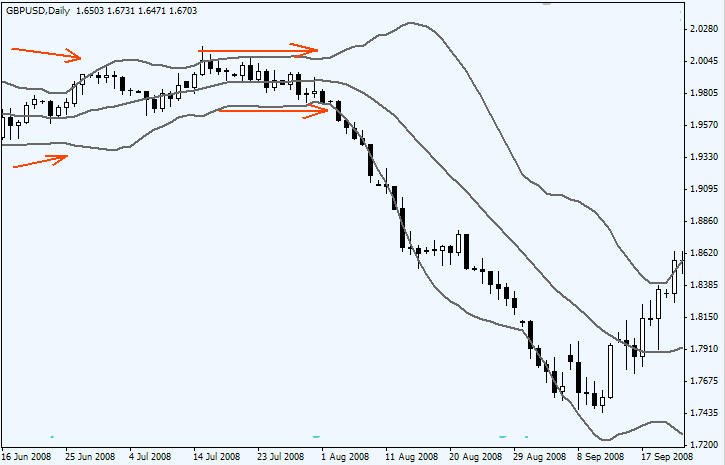
Low volatility, followed by a high volatility breakout.
When the Bollinger bands begin to narrow down to the point when they visually form a tight neat range (measured no other way than by the eye), as shown in the image below, signal the upcoming upcoming situation in volatility after market break.
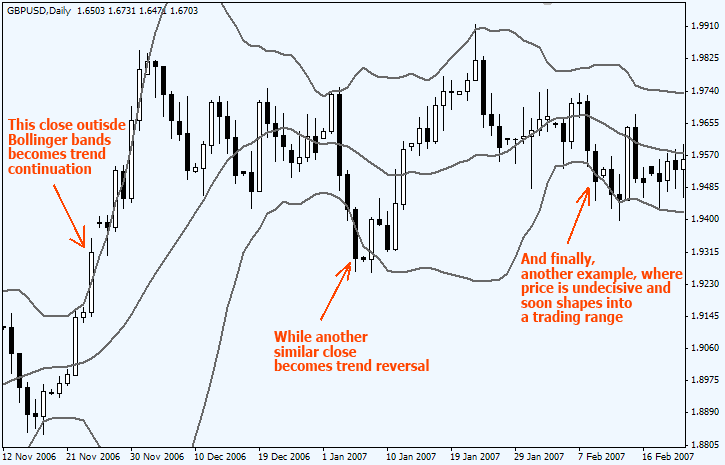
Prices move beyond the band – continuation of the trend
When the price moves and closes outside the Bollinger band up or down, this indicates a continuation of the trend. With that Bollinger band continues to expand as volatility increases.
At some point outside Bollinger band closure will mean price fatigue and reversal (reversal) of upcoming trends. With Bollinger band alone can not identify the pattern of continuation and reversal and require support from other indicators, as is often used is the RSI indicator, ADX indicator or MACD indicator.
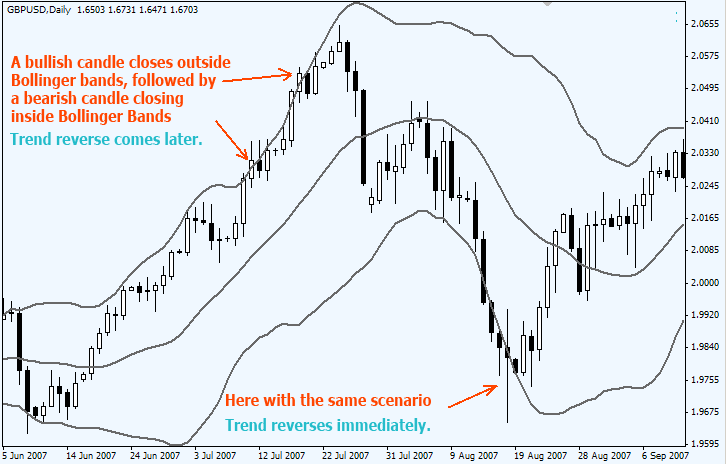
Trend Inversion with Bollinger Bands
As a rule, the closing of the candle outside the Bollinger band is then followed by the closing candle inside the Bollinger band serves as an early signal forming a reversal trend. However, it is not a 100% guarantee of a direct reversal trend.
W and M Patterns with Bollinger band
A double top or M pattern is a Sell signal. The Bollinger band pattern occurs when the following sequence occurs:
- The price penetrated the lower band,
- Pulling back to the midline,
- The next new lowest price is formed, and this lowest price is above the lower band and never touches it.
- Setup is confirmed when the price reaches and crosses the center Bollinger line.
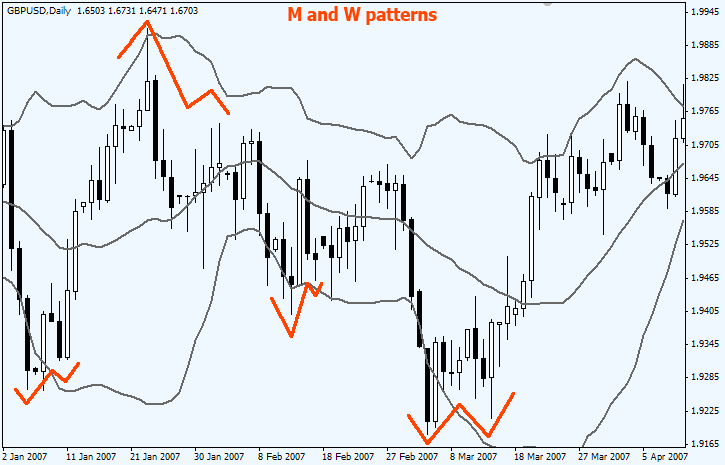
In fact, a very conservative trading approach requires prices to cross and close on the other side of the Bollinger band midline before a trend change is confirmed.
As you may see, in the middle of Bollinger band is just a line of 20 SMA (default). Simple Moving Average (SMA) by itself is widely used as a stand-alone indicator, which helps traders identify prevailing trends and confirm trading signals.


